
Free GSSI DZT Files — Ground Penetrating Radar Sample Data
Download real DZT sample files, learn what the format contains and how to open it
The DZT file format is the native data format of GSSI (Geophysical Survey Systems, Inc.) Ground Penetrating Radar systems — the most widely used GPR equipment in the world. Every GSSI acquisition produces DZT files containing the raw radar traces, acquisition parameters, and positioning information recorded in the field.
GPRbase provides free DZT sample files from real surveys: reinforced concrete inspections, underground utility detection, geotechnical investigations, archaeology, and more. All files are raw, unprocessed data — exactly as recorded by the equipment. They are distributed under Creative Commons BY-NC-SA 4.0 for education, research, software development, and testing.
Whether you are developing DZT-compatible software, learning GPR data processing, testing a parser, or teaching radargram interpretation, these authentic sample files give you real-world signal complexity that synthetic data cannot provide.
Free DZT sample files
Every dataset below contains raw .DZT files — download and explore — 34 datasets available
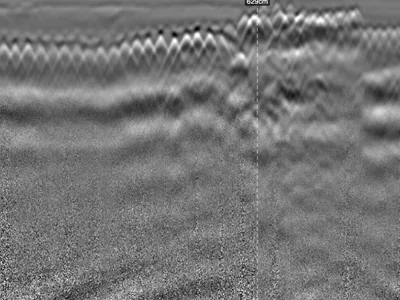
Reinforced Concrete Accessibility Ramp: Three Frequencies, Two 2.5 GHz Antennas and Cross-Polarisation on the Same Profile
Reinforced concrete accessibility ramp surveyed along the same profile with three configurations: dual-frequency UtilityScan DF at 300/800 M…
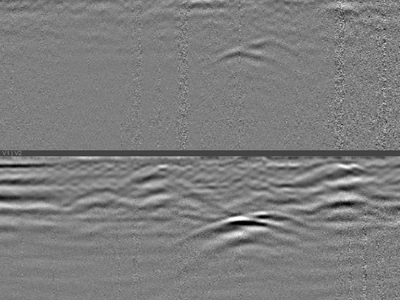
Buried Utilities Beneath a Reinforced Concrete Slab: Detection Through Dense Reinforcement
A 4.50 m profile recorded with a GSSI UtilityScan DF dual-frequency 300/800 MHz antenna, on a reinforced concrete slab, perpendicular to the…
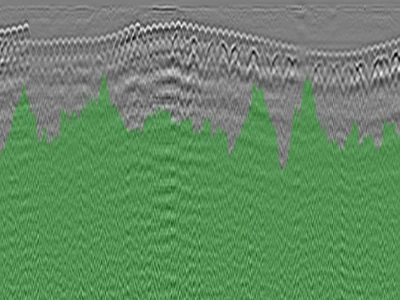
GPR Survey of a Car Park Raft Slab Showing Multiple Defects and Forms of Distress
Profile recorded on the raft slab of a car park showing multiple forms of distress, with a GSSI NX15 antenna at 1.5 GHz. One file. Two phen…
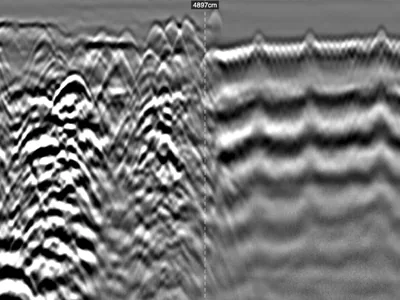
Industrial Slab GPR Survey: Heterogeneous Reinforcement and Subgrade, Inputs for Bearing Capacity Assessment
Profile recorded on a factory floor with a GSSI UtilityScan DF dual-frequency 300/800 MHz antenna, ahead of new works. No records exist, no …
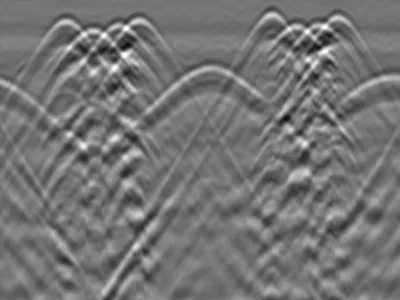
Circular Reinforced Concrete Column : Perimeter Scan and Rebar Repositioning in Section View
Circular reinforced concrete column, 20 cm radius, surveyed by horizontal scanning around its full perimeter with a GSSI FLEX NX dual-channe…
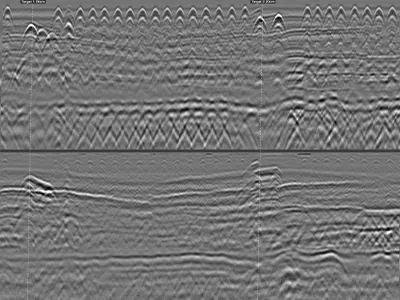
Reinforced Concrete Beam: Continuous Longitudinal GPR Survey with Markers at Two Columns
Reinforced concrete beam, 35 cm thick, surveyed continuously over more than 9 metres with a GSSI FLEX NX antenna. Two user markers were plac…
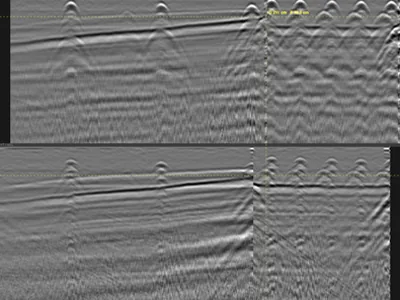
T-Shaped Retaining Wall: Variable Thickness from a Vertical then Horizontal GPR Profile
T-shaped retaining wall surveyed with a GSSI FLEX NX antenna. A single profile, run first vertically up the stem, then horizontally, without…
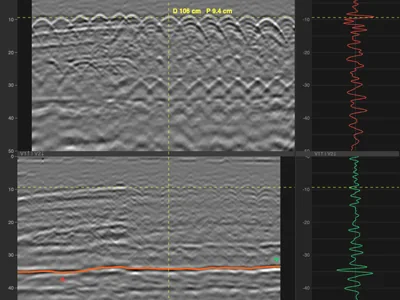
Reinforced Concrete Column — Cross-Polarisation to Image the Far Face and Calibrate Permittivity
Reinforced concrete column surveyed on all four faces, labelled A, B, C and D, by vertical scanning from bottom to top along the centre line…
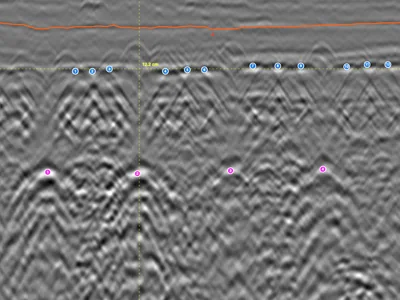
Beam-and-Block Floor — Cross-Polarisation on Inline and Cross-Line Channels
Radargram recorded on a beam-and-block floor with a GSSI FLEX NX stepped-frequency antenna, dual channel: one antenna oriented inline, the o…
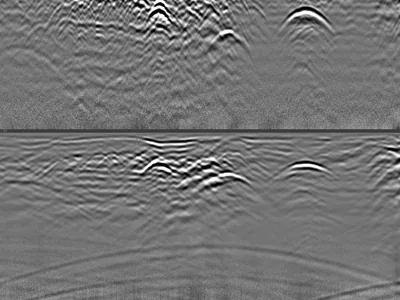
Multiple Utilities and Airwave — Distinguishing Surface Reflections from Buried Targets
Utility survey acquired with a GSSI UtilityScan DF dual-frequency antenna, showing several buried utilities together with a clear airwave si…
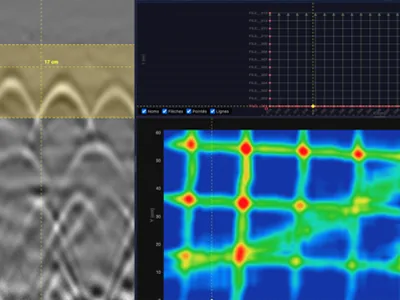
3D Grid on Reinforced Concrete — Rebar Mesh and Diagonal Electrical Cable
3D grid acquired on a reinforced concrete slab with a GSSI StructureScan XT 2.7 GHz antenna: 38 profiles over a 1.2 × 0.6 m area. The horizo…
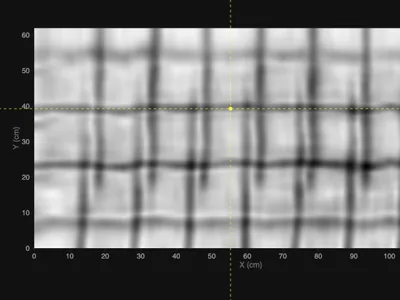
3D Grid on Reinforced Concrete — Welded Mesh Overlap for Rebar Picking
3D grid acquired on a reinforced concrete slab with a GSSI NX25 stepped-frequency antenna, over a 1.2 × 0.6 m area. The slab contains two la…
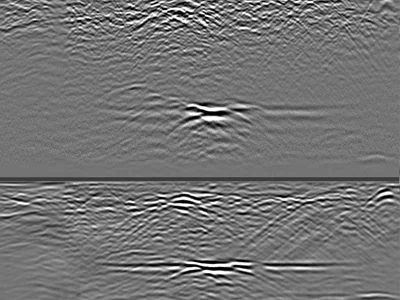
Confirmed Karst Cavities in Limestone — 300 MHz GPR Profiles to 4 m Depth
Raw GPR profiles acquired over limestone containing confirmed karst cavities, using a GSSI UtilityScan DF dual-frequency antenna. The 300 MH…
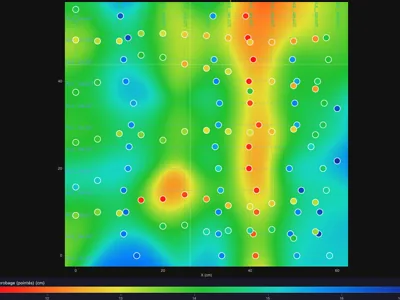
3D Grid on Densely Reinforced Concrete — Rebar Picking and C-Scan Tuning
3D grid acquired on a densely reinforced concrete structure with a GSSI StructureScan XT 2.7 GHz antenna, over a 60 × 60 cm area. The high b…
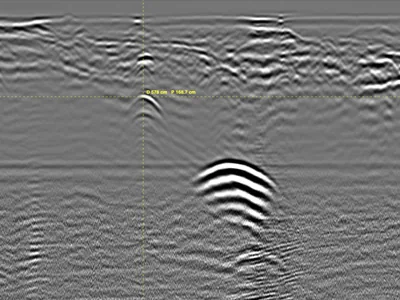
Unrecorded Utility Crossing Under a Street — Parallel GPR Profiles at 350 MHz
Utility survey on a street, acquired with a GSSI UtilityScan 350 MHz HyperStacking antenna: 9 parallel profiles spaced 1 m apart, crossing t…
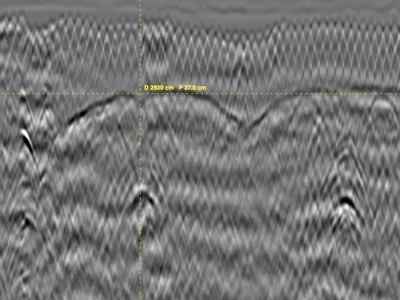
Masonry Vaults in a Historic Monument - Ground penetrating radar - 2 profiles
GPR survey inside a historic monument, acquired with a GSSI UtilityScan DF dual-frequency antenna to locate masonry vaults and characterise …
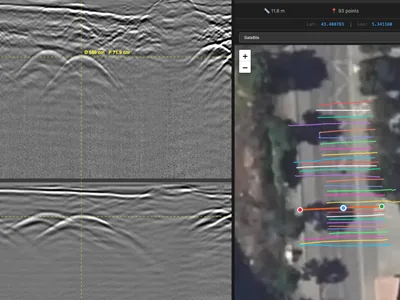
Georeferenced Multi-Utility Mapping - 30 RTK GPR Profiles at 300/800 MHz
Multi-utility GPR survey acquired for cartographic updating ahead of planned works, with a GSSI UtilityScan DF dual-frequency antenna. 30 pr…
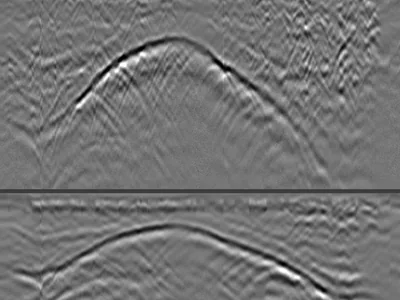
Rib Vault GPR Survey from Above — Backfill Thickness and Structural Geometry
GPR profiles acquired from above a rib vault in a cathedral, with a GSSI UtilityScan DF dual-frequency antenna. Three profiles crossing the …
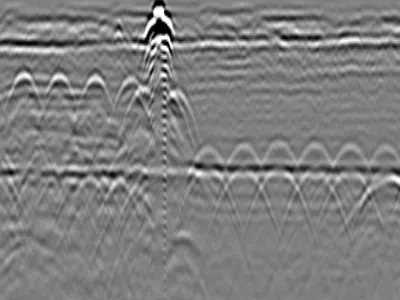
Reinforced Concrete Slab with Expansion Joint
GPR dataset containing 7 files collected on a reinforced concrete slab using a GSSI FLEX NX structure-scanning radar. The data clearly show …
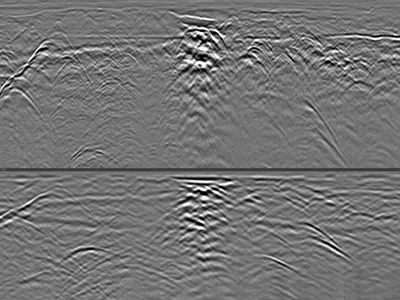
Utilities & Interfaces in Favorable Soil with Deep GPR Penetration
GPR dataset containing 1 file collected with a GSSI UtilityScan DF dual-frequency 300/800 MHz ground penetrating radar in highly favorable s…
What is a DZT file?
A DZT file is a binary data file produced by GSSI Ground Penetrating Radar systems. It contains a file header (acquisition parameters: antenna frequency, samples per scan, range, dielectric constant settings) followed by the raw radar traces — each trace being a column of amplitude values representing reflected energy versus time. One DZT file typically corresponds to one survey line or one continuous acquisition. Companion files may include .DZG (GPS positions) and .DZX (project configuration).
How to open DZT files?
The simplest free option is GPRviewer, published by MDS: it opens DZT files directly and displays the radargram with gain, filters and measurement tools, no licence required. Geolitix offers online 2D and 3D processing and interpretation, with a free account for small projects. Several open-source libraries also read DZT: readgssi (Python), GPRPy (Python) and RGPR (R). For developers, the DZT header structure is documented in GSSI's SIR system manuals.
What a GSSI acquisition contains
An acquisition is not always a single file. The .DZT carries the radar data itself: the traces recorded along the profile and the acquisition parameters. When the survey is georeferenced, a .DZG comes with it, holding the positions recorded during the measurement. A .DZX may be added, describing the project and its configuration.
These files are linked by their base name: renaming one without the others breaks that link, and a georeferenced survey then loses its coordinates. This is why GPRbase archives keep the original names and the folder structure as recorded by the instrument, including the per-channel subfolders of multi-antenna acquisitions.
Compatible GSSI equipment
All GSSI systems produce DZT files: the current FLEX NX (2.5 GHz), NX25 (2.5 GHz), and NX15 (1.5 GHz) for concrete inspection, plus utility detection and geophysical systems across the frequency spectrum. The datasets on GPRbase were acquired with various GSSI antennas — each dataset page specifies the exact equipment and frequency used, so you can find sample files matching your target hardware.
What you can do with these files
A DZT file is displayed as a radargram: an image where the horizontal axis is distance travelled, the vertical axis two-way travel time, and pixel intensity the amplitude of reflections. Point targets such as rebar or pipes appear as hyperbolas, layer interfaces as continuous reflections.
From there, uses diverge. In training, you practise rebar picking, cover measurement, interface tracing and the conversion of travel time into thickness. In development, you test a reader against varied antenna and frequency configurations. In research, you work with raw untreated signal — with the noise, imperfect coupling and ambiguous signatures that a simulation does not reproduce.
Download free DZT sample data
All GPRbase datasets contain raw DZT files, free to download under CC BY-NC-SA 4.0. Use them to test your DZT-compatible software, validate parsers against real multi-antenna data, build teaching material, or train machine learning models. Each dataset documents the antenna, frequency, and targets — pick the samples that match your use case below.
Reading DZT metadata programmatically
For every dataset, the GPRbase catalogue exposes in JSON the antenna used, the frequency, the file count and the survey targets — without opening a single DZT file. Useful for assembling a test set covering several acquisition configurations before developing or validating a reader.
Frequently asked questions — DZT files
Can I open DZT files without proprietary software?
Yes. GPRviewer (free, by MDS) opens DZT files directly. Open-source options include readgssi and GPRPy in Python, and RGPR in R. No GSSI license is needed to read the format.
What is the difference between DZT, DZG and DZX files?
DZT contains the radar data itself (header + traces). DZG contains GPS positions recorded during acquisition. DZX stores project and configuration information. Only the DZT is essential for viewing the radargram.
Can I convert DZT files to other formats?
Yes. Python libraries like readgssi can export DZT data to CSV, numpy arrays, or images. Many GPR processing packages import DZT and export to SEG-Y or their own formats.
Are these DZT files raw or processed?
All GPRbase datasets are raw, unprocessed DZT files — exactly as recorded in the field. No filtering, gain, or migration has been applied, making them ideal for testing processing pipelines from scratch.
Can I use these DZT files to test my own GPR software?
Yes, that is one of their main purposes. CC BY-NC-SA 4.0 permits software testing and development use. Real files from different antennas and site conditions are ideal validation material.
Need to visualize these DZT files?
GPRviewer is a free 2D visualization tool published by MDS. Open any DZT file, adjust gain and filters, measure depths — no license required.
Discover GPRviewer